

The ERM for Nature
Nature risk.
Quantified.
Board-ready climate & biodiversity - site-level insights turned into strategic decisions.


What is refinq and how does it help organisations manage climate and nature risks?
refinq is a cloud-based Nature Intelligence platform that quantifies, visualises, and monitors climate and nature-related risks at the asset level. It identifies material nature-related risks across assets and supply chains, quantifies their potential financial impact, and provides practical mitigation and adaptation actions tailored to each site. The platform is designed to support full compliance with IFRS S2, ESRS E1 to E4, EU Taxonomy, and TNFD frameworks, ensuring organisations can meet regulatory demands while strengthening long-term operational resilience.
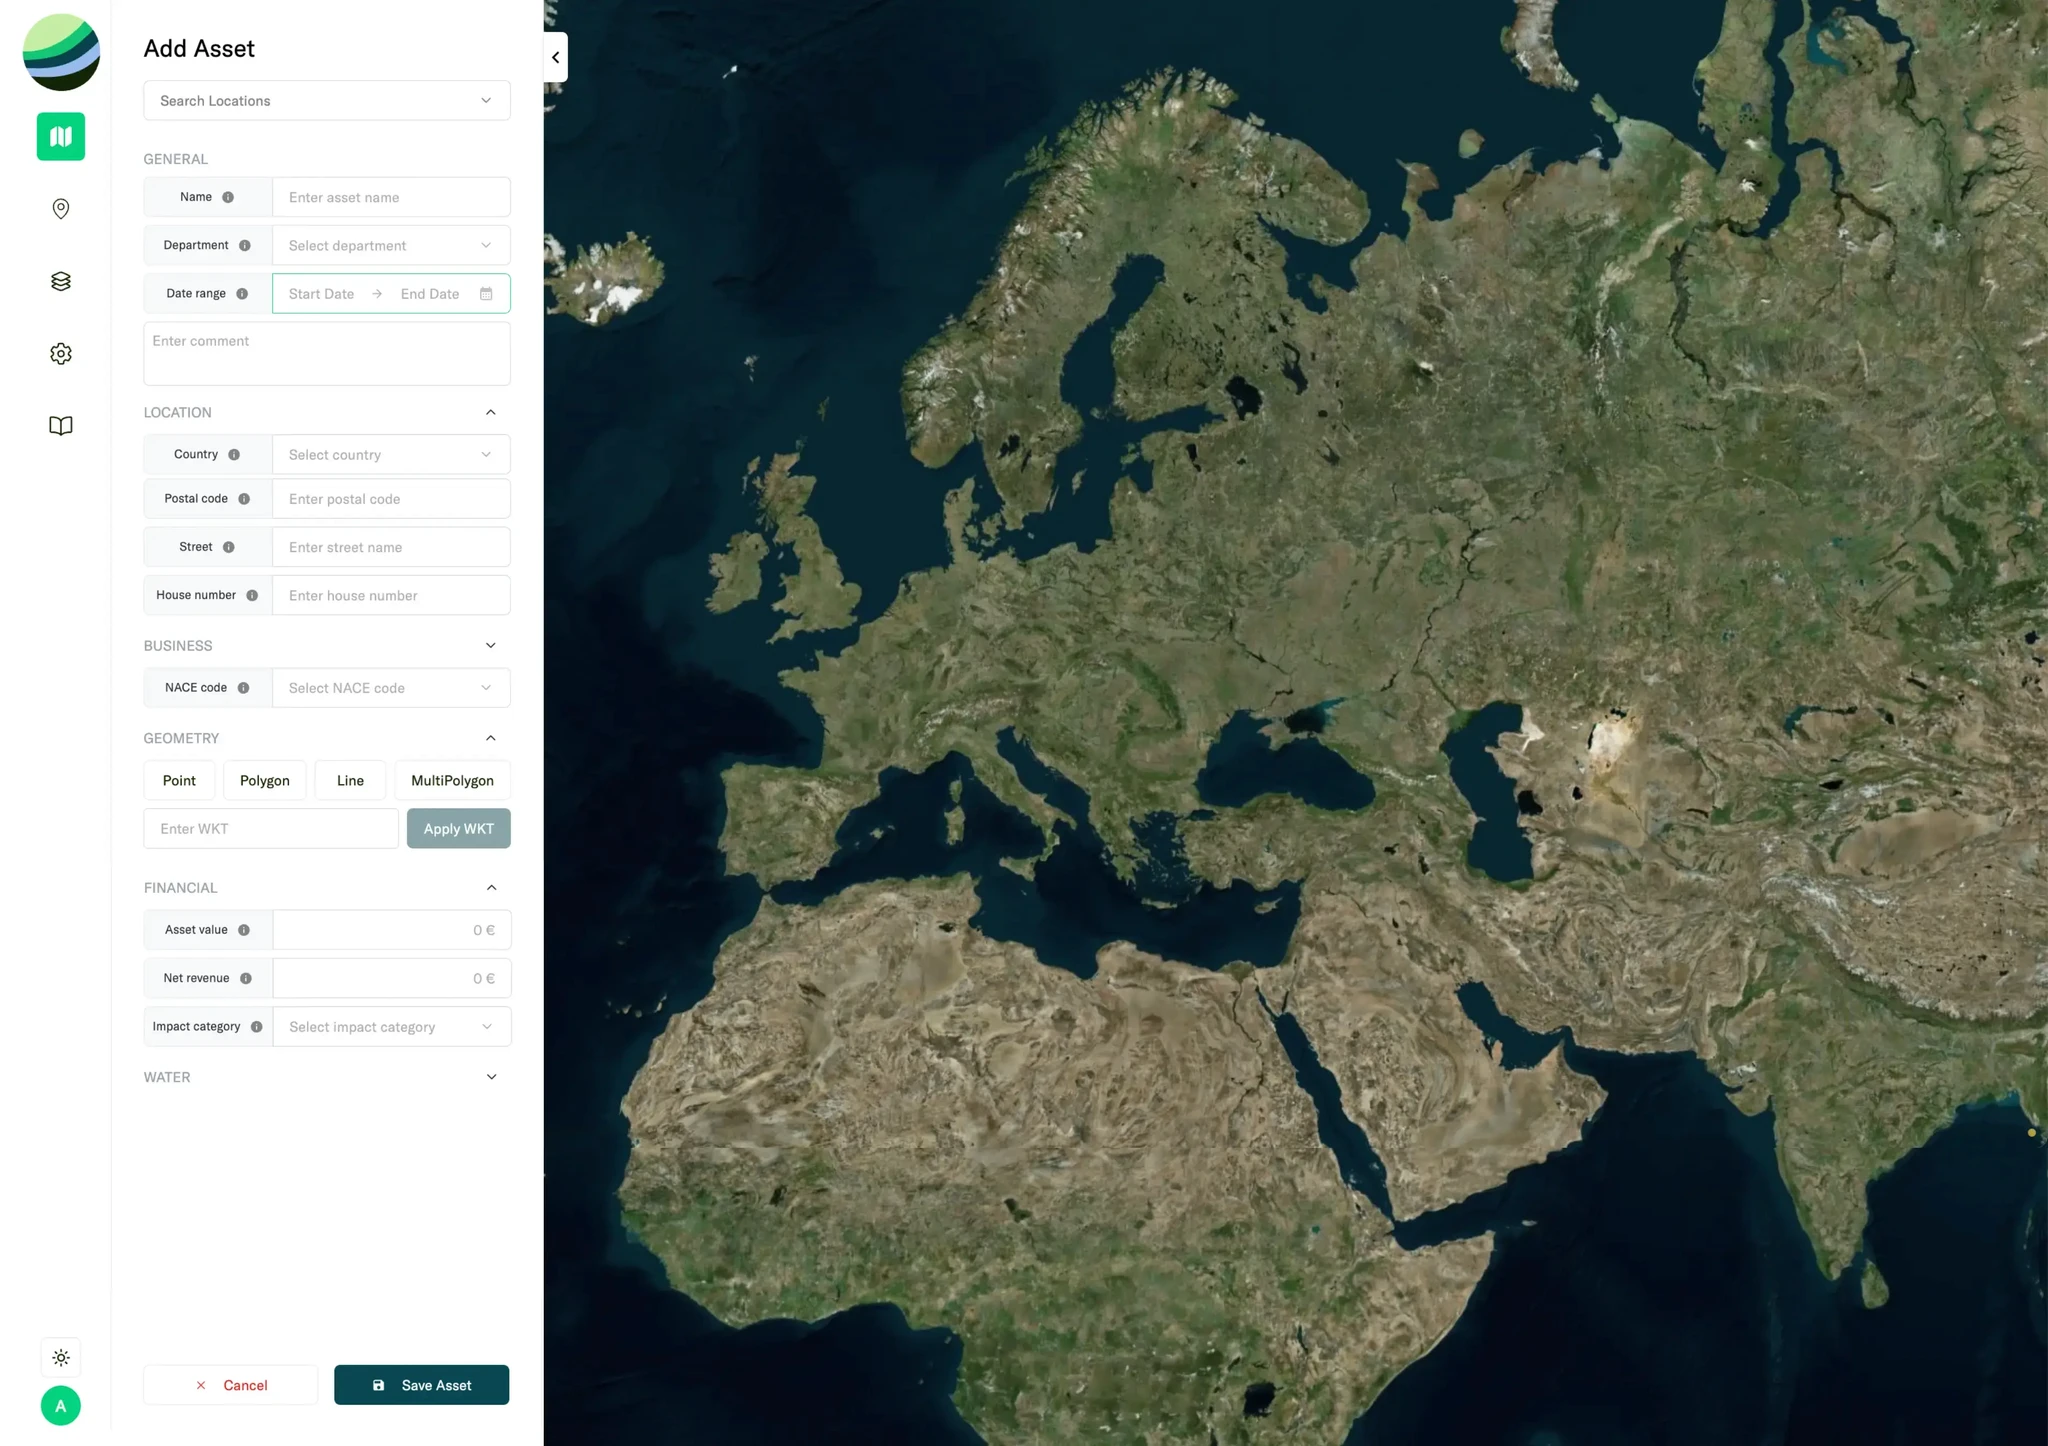
Which data does refinq need to perform a risk assessment?
The platform requires only essential inputs, such as the geographical location of each asset and its business activity classification. Additional data, like asset value, water consumption, adaptation measures, or building structural characteristics, can be included to refine assessments but are not mandatory. Where information is missing, refinq applies conservative assumptions to ensure results remain robust and actionable.
What types of climate and nature risks does refinq assess?
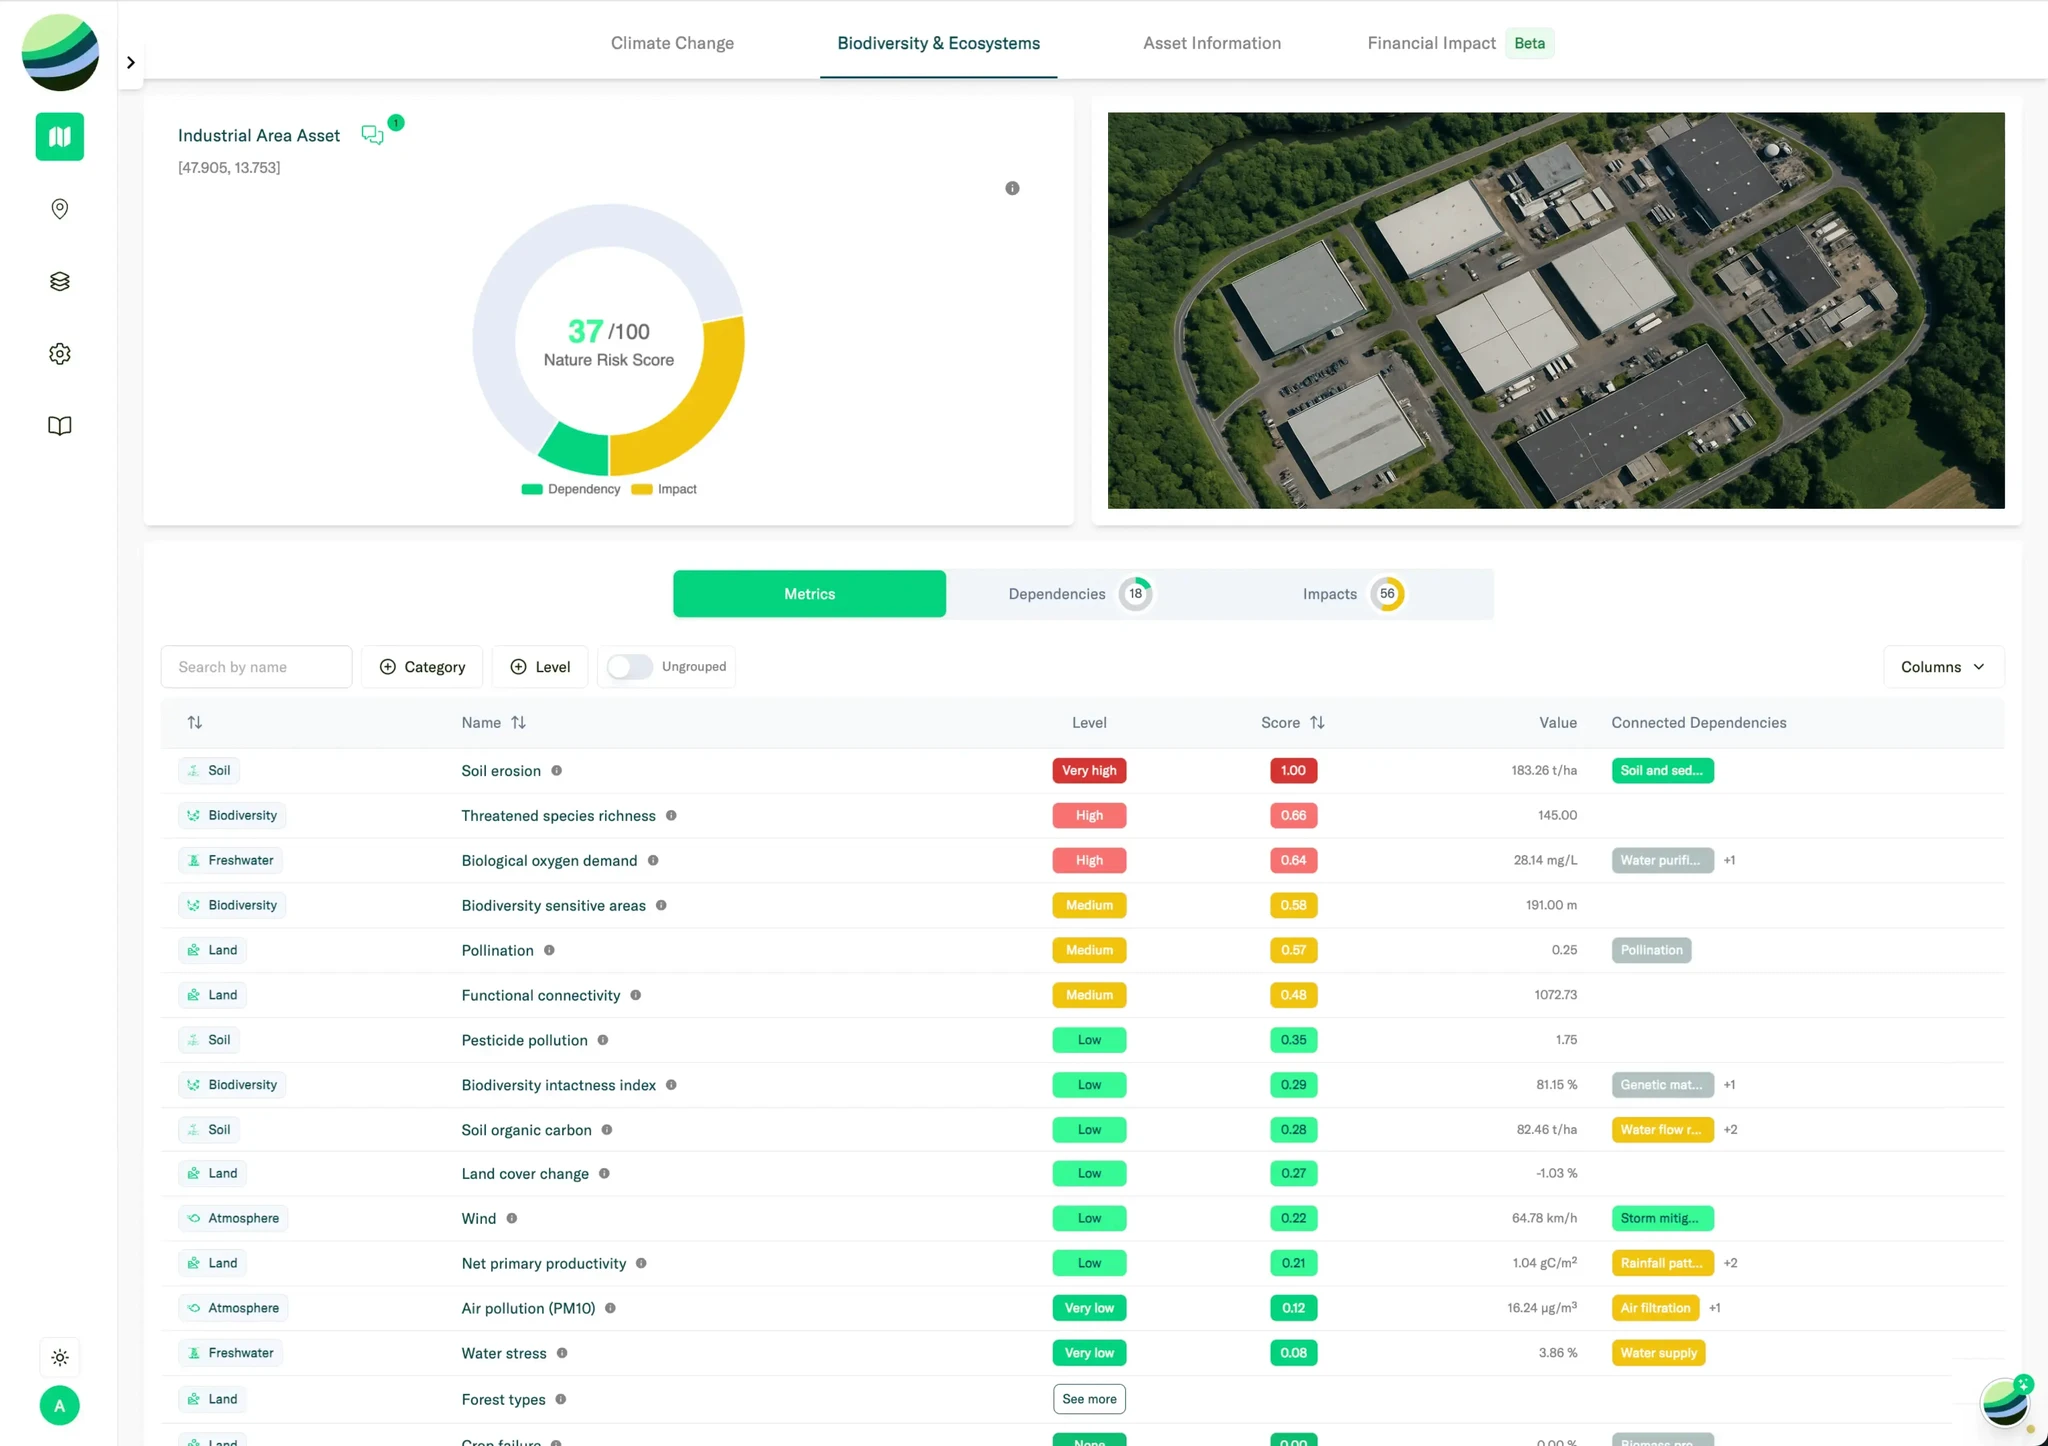
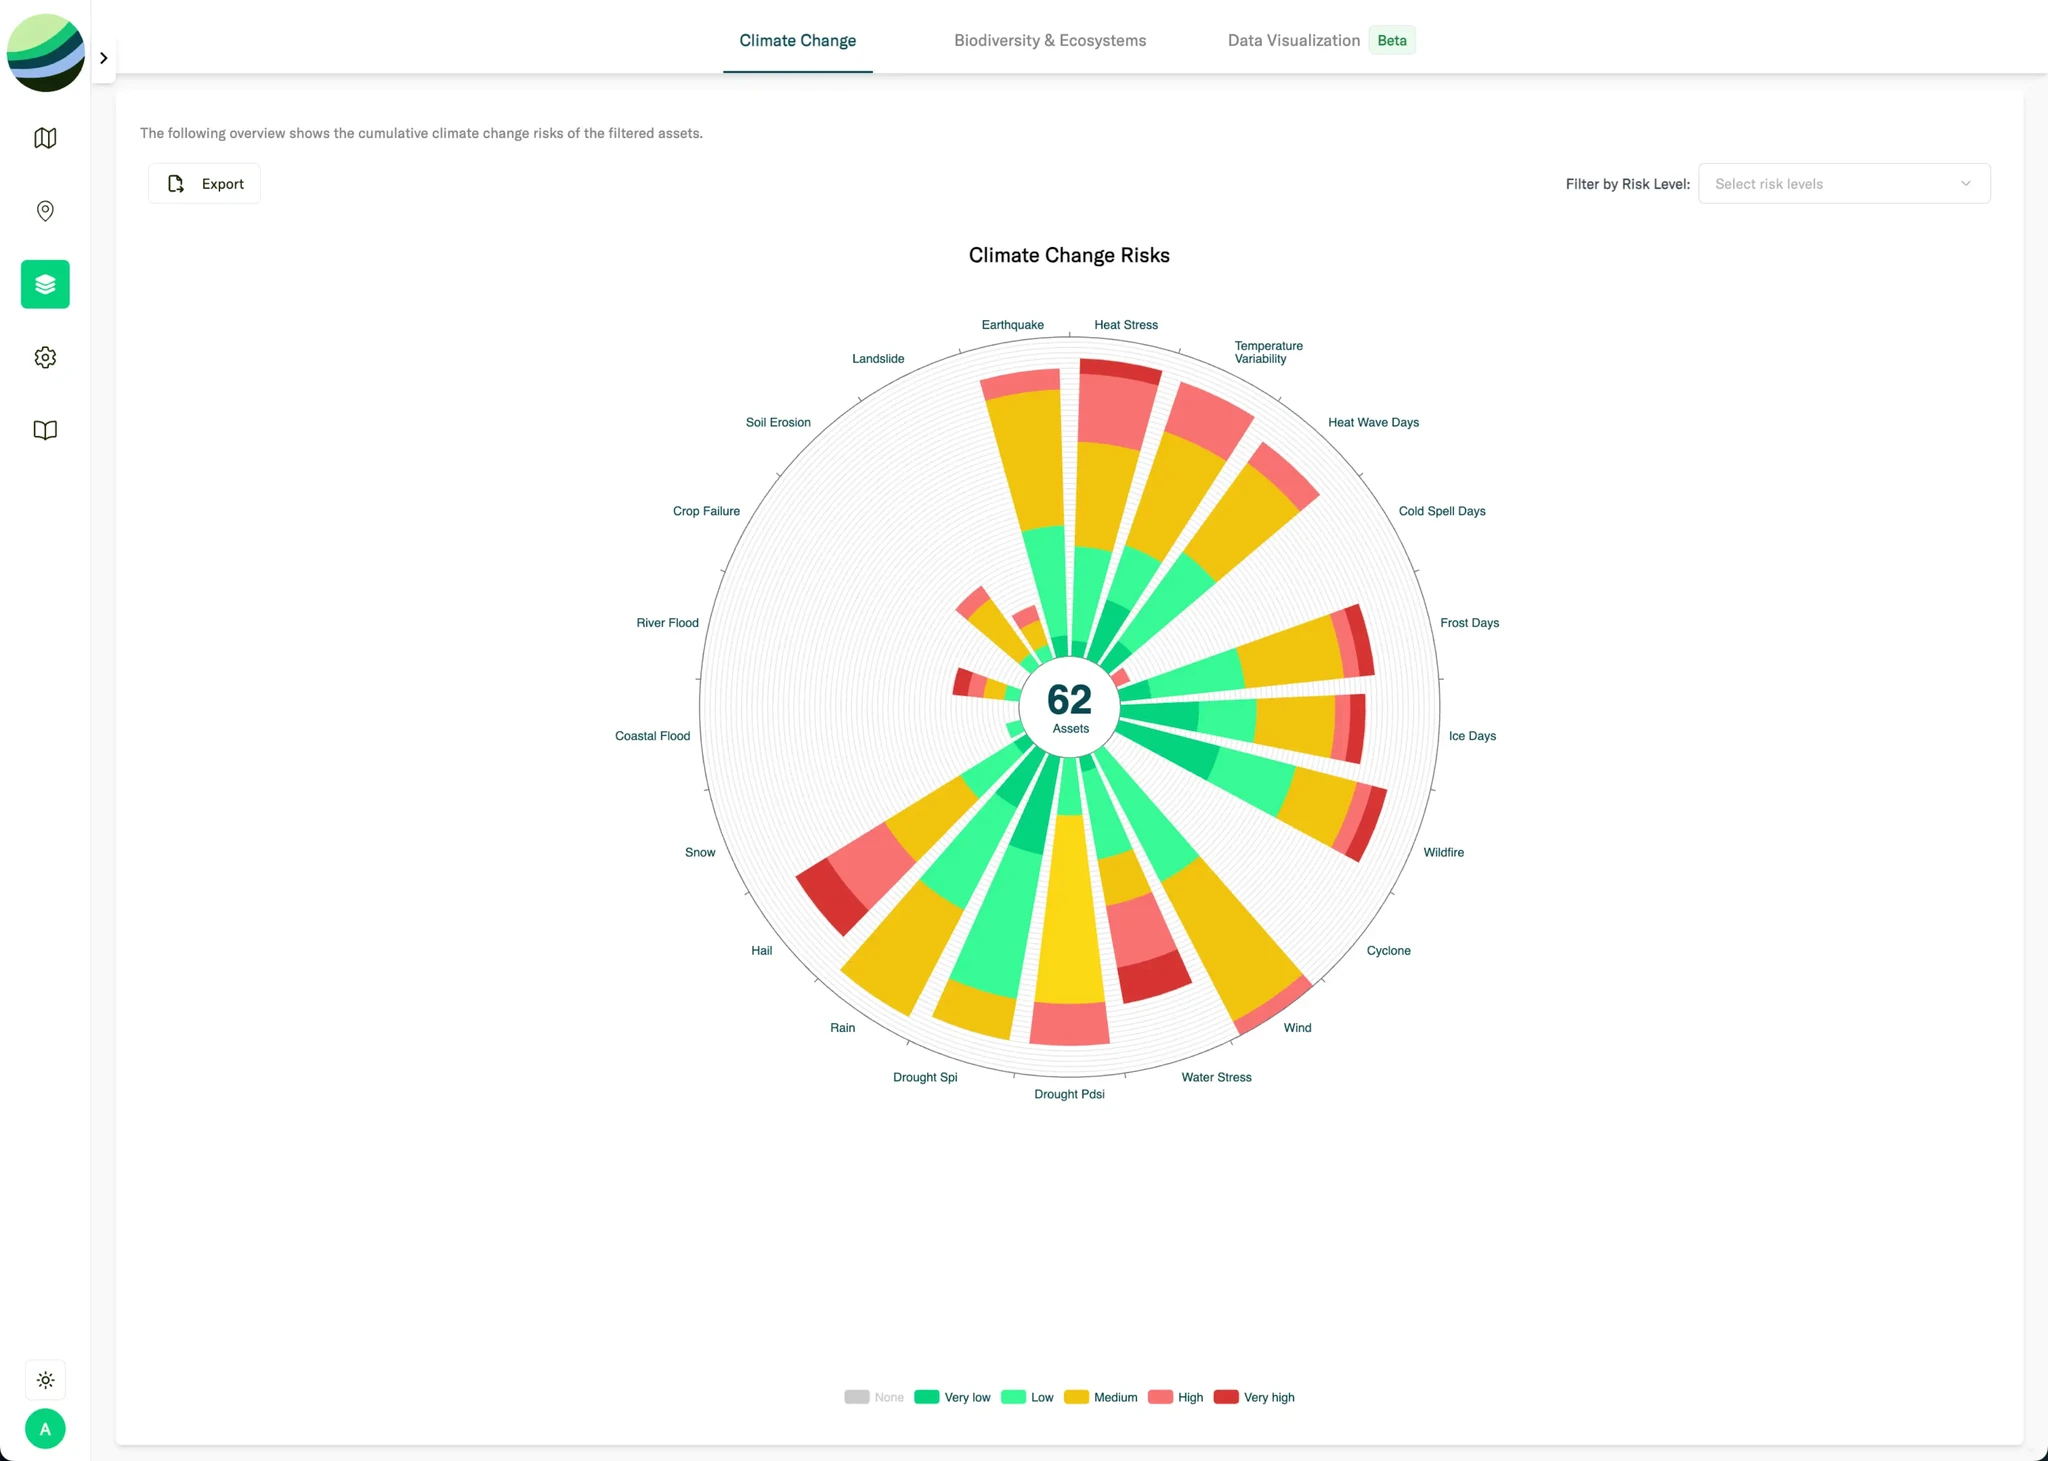
refinq assesses the full spectrum of physical and transition risks across both climate and nature. This includes physical climate hazards such as extreme heat, flooding, windstorms, drought, and wildfires, as well as nature-related physical risks like biodiversity intactness, species extinction risk, land degradation, forest fragmentation and soil organic carbon. We also evaluate transition risks, including regulatory, market, technological, and reputational drivers, that may impact companies as policies tighten and expectations evolve around climate and biodiversity. Risk results are location-specific and available across multiple IPCC AR6 scenarios and time horizons, offering a comprehensive view of future exposure.
How granular is your climate and nature data?
We generate asset-level climate and nature risk assessments globally using high-resolution environmental datasets, enabling far more granular analysis than typical sources. Depending on the hazard, refinq uses resolutions such as ~25 m for landslides, ~100 m for soil erosion, and ~10 km (5′) for water stress. Our nature-risk layers include global 10 m land-cover change data and 500 m Net Primary Productivity (NPP). This level of granularity allows organisations to pinpoint risks at individual sites with high accuracy and confidence.
Does refinq comply with global reporting standards and frameworks?
Yes. refinq is fully aligned with leading global disclosure standards and frameworks, including TNFD, TCFD/IFRS S2, ESRS, EU Taxonomy, and SBTN. The platform generates audit-ready outputs that simplify documentation, support external assurance, and streamline climate- and nature-related disclosures across regulatory and voluntary reporting requirements.
What is the temporal coverage and frequency of refinq’s climate and nature datasets?
refinq uses historical climate baselines dating back to 1851 and provides future projections through 2100 under multiple IPCC AR6 SSP–RCP scenarios, including SSP1–2.6, SSP2–4.5, SSP3–7.0, and SSP5–8.5. Temporal frequency varies by hazard, water stress, temperature and precipitation-related metrics are available in monthly and annual time steps, while satellite derived information, such as NDVI can be provided bi-weekly in less clouded regions. Default assessments use 30-year horizons with configurable checkpoints such as 2030, 2050, and 2080 to align with asset lifetimes and planning cycles. refinq’s biodiversity layers span 2000 to 2025, or the most recently available year. They capture global trends in land-cover change, ecosystem condition, biodiversity loss, and species risk extinction, ensuring a consistent and up-to-date view of nature-related pressures across all assets.
What is the update frequency of refinq’s climate and nature datasets?
Both climate and nature datasets are automatically refreshed each year. This update process is embedded into refinq’s automated CI/CD data governance pipeline, ensuring that all baselines, projections, and derived risk indicators remain aligned with the most current scientific models and observational data.
How transparent is refinq’s data and methodology?
refinq provides full transparency across all datasets, models, and analytical assumptions. Every metric includes detailed documentation covering its description, data source, processing steps, and scoring thresholds. Our data originate from trusted scientific and institutional sources such as Copernicus, Joint Research Center (JRC), World Resources Institute, IUCN, and peer-reviewed datasets like Biodiversity Intactness Index. All methodological choices, including emission scenarios, model selection, and assumptions, are openly disclosed.
What outputs does refinq provide?
Users access a centralised dashboard that brings together portfolio-wide overviews, detailed site-level profiles, geospatial visualisations, and downloadable reports. Both assets and portfolios come with comprehensive data sheets and reports containing climate and nature risk metrics, financial impact estimates, and tailored mitigation and adaptation actions. All outputs are delivered in an audit-ready, standardised format aligned with leading international reporting frameworks, ensuring full suitability for CSRD disclosures and internal risk governance.
Can we customise risk thresholds or scoring in refinq?
Risk thresholds for state of nature and climate hazards are not customisable. These thresholds follow scientific, and peer-reviewed methodologies to ensure comparability, auditability, and compliance across portfolios. However, refinq provides flexibility where it matters: users can **adjust vulnerability, dependency, and impact risk scores at asset level** when they have site-specific information. For example, if an asset is less dependent on an ecosystem service, has water-efficiency measures, or already has adaptation actions in place (e.g., flood barriers), the platform updates risk scores, ensuring that risk levels reflect real conditions on the ground.
What is GaiaGuide, and how does it support action planning?
GaiaGuide is refinq’s AI-powered feature that translates climate and nature risk insights into tailored, science-based mitigation and adaptation measures for each location. Instead of stopping at risk identification and quantification, refinq provides practical, site-specific and nature-positive actions that organisations can implement immediately, bridging the gap between analysis and real-world resilience.
Does refinq help prioritise risks and track mitigation and adaptation measures?
Yes. refinq includes a dedicated **risk-monitoring and prioritisation module** that helps organisations identify which climate and nature-related risks require attention first. Portfolio-level insights and risk rankings highlight hotspots, while asset-level views clearly show which hazards, vulnerabilities, impacts, or ecosystem dependencies drive each risk score. Users can also document mitigation and adaptation measures already in place, such as water-efficiency improvements, or biodiversity-positive interventions. These measures dynamically update vulnerability, dependency, and impact scores so that risk levels accurately reflect real resilience on the ground.
Does refinq provide early warning or real-time insights?
refinq’s Weather Alert module offers 16 or 30-day forecasts for extreme weather events, supporting operational planning, incident preparedness, and short-term decision-making. These alerts complement the long-term climate risk analytics and can be integrated into existing operational workflows. For example, a retailer can reroute inventory and adjust staffing in advance of a forecasted heatwave or severe storm to prevent disruptions and protect operations.
Is refinq suitable for companies operating outside the EU?
Absolutely, refinq’s global datasets and regulatory mappings cover all regions and markets. While we support CSRD/ESRS compliance in the EU, our risk assessments are built for multinational and non-EU organisations as well.
Which industries benefit most from refinq?
refinq supports asset-heavy sectors (utilities, energy, manufacturing, infrastructure, real estate), financial institutions (banks, insurers, asset managers), and companies with global supply chains. Any organisation with physical locations or dependency on natural ecosystems can benefit from our platform.
Does refinq provide API access and support integrations with client systems?
refinq offers full API-based integration, enabling secure and seamless data exchange with client environments. The platform provides a comprehensive REST API, as well as bulk export capabilities (CSV and XLSX). Custom attributes are supported through flexible asset-level tags, and all data updates propagate across the platform in near real time, ensuring that analytics layers always receive the most current information. To support rapid onboarding and developer-friendly workflows, refinq provides **OpenAPI-compliant Swagger documentation**, offering a complete, interactive specification of all available endpoints. This enables teams to explore, test, and integrate with the API efficiently and reliably. Overall, the system is designed to fully support API-driven integrations and operational workflows.
Which data formats does refinq support?
refinq supports a wide range of geospatial and data formats, including CSV, XLSX, NetCDF, TIFF, ZARR, and GPKG, within its internal processing pipelines. To ensure seamless integration with organisational workflows, all client-facing outputs are delivered in easily usable formats such as XLSX, CSV, and JSON (via API). This makes the data fully compatible with common tools like Excel, Power BI, GIS platforms, and enterprise data lakes without requiring additional preprocessing.
What are the pricing options for refinq?
refinq uses an annual subscription model, with pricing tailored to the number of locations assessed, the volume of data or API usage, and the modules included - such as Physical Climate Risk, Biodiversity & Ecosystems, Transition Risks & Opportunities, Financial Impact, or the Weather Alert system. The commercial model supports batching through predefined SKUs (e.g., +100 sites), allowing organisations to scale their coverage and functionality over time as needs grow. Each subscription includes a 10-hour support package for onboarding, technical guidance, and expert Q&A, with the option to expand support hours, API capacity, or activate additional modules. The licence covers internal organisational use, while external redistribution of raw data requires prior approval.
What onboarding support does refinq provide during implementation?
refinq offers a structured onboarding process that includes guided setup, data validation support, and role-based training for technical and non-technical users. Clients receive a 10-hour support package as part of their subscription, covering onboarding assistance, technical walkthroughs, and expert Q&A to ensure a smooth start. After onboarding, users benefit from optional add-on support hours that can be scaled as organisational needs grow.
What documentation are available to clients?
Clients receive comprehensive technical documentation, full dataset metadata, and detailed methodological assumptions, as well as access to our Solution Architecture and Security overview via trust.refinq.
How does refinq handle identity and access management (SSO, roles, and user IDs)?
refinq integrates with enterprise identity providers via SAML-based SSO (e.g. Microsoft Entra ID) and supports configurable user ID formats to match client standards. Access is managed through role-based access control (RBAC) with the principle of least privilege, allowing permissions to be grouped by user role and managed centrally. User lists can be exported via API or the admin interface for reconciliation with internal identity management systems.
What password and authentication security controls does refinq use?
refinq enforces strong password policies, including minimum length, complexity requirements, prevention of password reuse, and mandatory password change on first login. Passwords are never stored in plain text, only hashed, non-recoverable values are kept, and session timeouts and account lockouts after repeated failed attempts provide additional protection. Multi-factor authentication (2FA) is supported via the client’s SSO provider.
How does refinq protect data and monitor security (encryption, logging, and audits)?
All data in transit is protected with HTTPS/TLS 1.3, and all databases run on encrypted storage. Sensitive fields are encrypted or masked, and client data is logically segregated in a multi-tenant architecture. The platform generates detailed audit logs for access and data changes, stores them centrally and securely, and retains them for at least one year with recent logs available for immediate analysis. Clients may conduct penetration tests, and refinq maintains formal information security, data protection, backup, and disaster recovery policies, with ISO 27001 certification in progress and cloud provider SOC reports available on request.